Category Archives: Fundamental Analysis

Keep getting in touch with the business world

Today is the first time I have seen RT in such high spirits since a long time. He came in earlier than usual, instead of starting up his laptop, the first thing he did was to take out a few pieces of loose papers and flashed at me. They are photocopied newspaper cuttings of company news on water and energy sectors, two of them were on Hyflux and another big player in the same field, Boustead. He also passed me this month’s edition (June) of Pulses, featuring CEO of Boustead, Mr. FF Wong. In the magazine, there were also some important financial figures showing constant growth in terms of revenue and profits (in 2007, a bit low, could be due to expenses). In a gist, Mr. Wong expressed a very positive outlook and aggressive roadmap for Boustead not only in its field of infrastructure building, already expanding water and wastewater business, but also geo-spatial services, an area which provides solutions for optimisation of land and space resources. Its subsidiary Salcon, apparently a direct competitor to Hyflux, is also venturing into Middle East market, on top of its current NEWater plant locally. The magazine also covered stories on Capitaland and Goodpack and many other inspiring articles; and very coincidentally, these companies were mentioned during the TA course that we attended a few days ago and we seemed to appreciate more and more on the business talk. Could it be sheer serendipity, or is it us getting better in touch with the business world? Whatever that is, I reckon that continuous hardwork and research will definitely pay off one day.

Verifying Buffett

It was reported that Warren Buffett’s Bershire Hathaway had increased its stake in Kraft to 138.8 million shares from 132.4 million. Being a little skeptical, I checked the P/B ratio and P/E ratio of Kraft to see if it was indeed ‘under-valued’ when the king of ‘value investing’ made the purchase. Here is the finding: P/B Ratio: 1.8 and Current P/E Ratio: 20.4 (and it has been +/- 20 recently). If we strictly go by the academic definition, with P/B ratio>1, Kraft is not traded ‘under-book-value’ technically. So, does it mean that Warren Buffett has deviated from his ‘value investing’ framework? Well, not necessarily. In my opinion, in a gist, the rationale behind value investing is about value for money. Before Warren Buffett makes a purchase, as long as the price is ‘reasonable’ and he sees the growth in value, he will make the move. The reasonable price does not always mean one that is below book value. In fact, what Warren Buffett or an experienced value investor finds worth paying for is the book value + ‘something extra’. This ‘something extra’ can be something tangible or intangible such as business fundamentals, brand name, potential revenue and earnings growth, market demand, products, management, recession-proof, etc. Kraft has good business fundamentals, strong earnings and is recession-proof which made Warren Buffet believe that it was reasonable to pay a price at 1.8x its book value. (Well, how much is unreasonable? Only Warren Buffet would know.) Also, today, with information and news about corporates being widely available and transparent on the internet, the chances of good and undervalued stocks go unnoticed are very low, market reacts faster and prices are adjusted quicker as compared to the past, good and undervalued stocks will soon become not-undervalued. Therefore, we cannot blindly apply the ‘hard figures’ that were used during Benjamin Graham’s days (such as very low PE and PB<1) in today’s context. Even if we spot a handful of stocks that fulfill such hard criteria, the companies that are indeed being traded below book value could be ones that are really in deep trouble and hence the situation is reflected on the stock prices. For Kraft’s case, both P/B ratio and P/E ratio are considered not high as compared to many other growth stocks in the market, and coincidentally, these numbers are not far from the ‘benchmark’ figures used by my friend ET as he mentioned earlier: PE=15, PB=2.

So Kraft is a good buy. Say cheese. 🙂

Earnings vs Market Cap

I don’t usually get MSN messages at 8am in a public holiday morning.

But I did get 1 today from my good friend ET.

ET has read my report on Hyflux last night and he was eager to share with me what he thought first thing in the morning.

I really appreciate his enthusiasm.

Something new that I have learnt from him is that he uses:

EARNINGS/MARKET CAP x 100%

as the yield of stock.

Hyflux’s market cap is $3 billion. Earnings in 2007 is $32,949,000. Based on this formula: Yield of Hyflux stock is therefore 1.1%.

The following is an excerpt on what ‘discussed’ online:

ET:

i just read the report

ET:

was good in general, though conclusion is not firm

DW:

thanks

DW:

cos at this point, I want to wait for the market to be more clear before I can firm up a plan, so conclusion is to keep a close eye on Hyflux

ET:

anyway, good try, though if i were writing, definitely, the conclusion is: don’t buy @ current price

ET:

i would be uncomfortable owning something with PB > 2+ without strong reason

DW:

but the thing I don’t know what price is good.

DW:

cos some people like O’Neal, he cares more about growth than PB or PE

ET:

even growth has been inconsistent in the net profit

DW:

agree

ET:

revenue growth is one thing, but if it’s achieved @ net profit expense, growth is useless

DW:

net profit was not consistent because of 2006 figures

DW:

I think we can wait for 1 to 2 more years to see if the net profits are consistent, need more data to support

ET:

and u mentioned she bought sino….

DW:

yes, SinoSpring

DW:

she put in more stakes

ET:

well, i hope this is not just to drive up the revenue

DW:

was only 50% then 80%

DW:

no, in fact the year she bought SinoSpring, SinoSpring had a revenue decrease…that’s something I don’t understand!??

ET:

when growth slows down, companies tend to go M&A way

ET:

ic

ET:

is Sino spring @ public listed company?

DW:

Err…don’t think so…need to check

DW:

but SinoSpring owns a lot of desalination plants

ET:

Hyflux in general has a good future, but seems it’s priced in the share

DW:

i agree

DW:

PB and PE are ridiculously high. BUT BUT…again I want to find out if this is also equally high for other companies in the same industry in the world.

ET:

that’s a good idea

DW:

and also…..

DW:

1 thing I am not good at mastering is to come out a price objective.

ET:

well, I would do that with 2 measures

DW:

tell me more man.

ET:

1. p/e (if it has stabilized)

ET:

2. book value

ET:

if pe= 15, and PB = 2, I guess in general it seems to indicate fair value (with average growth rate)

ET:

however if pe < 15, or PB < 1, maybe worth buying, especially if the PE < 10, probably a bargain

ET:

that’s my standard

DW:

but how did you come out these benchmark numbers?

ET:

to make it simple

ET:

think of yield of bond

DW:

ok…i am familiar with bond..

ET:

earning/ market cap * 100% is stock yield

DW:

oh…

DW:

if earnings/market cap of Hyflux..say…10% then consider not bad?

DW:

this is interesting…

ET:

if earning has been stable, yes

DW:

did you come out this concept yourself..or you read it from somewhere?

ET:

I definitely read it from somewhere long ago

ET:

which i could not recall

ET:

i guess even intelligent investor has some section in it

DW:

very good..you remember the important concepts

DW:

okay…i’ll try to re-read.

ET:

it discusses valuation model -> by net asset, earning, and dividend

ET:

I tend to remember if I practise it

ET:

hence, i seldom write it

ET:

writing is a chore to me

DW:

haha…

DW:

Don’t need to write…just draw some mind map…

ET:

now, gtg

ET:

have a few hundreds pages to go

ET:

about john kenneth galbraith life

DW:

who is he?

ET:

great economist born in canada, who is influenced by  keynes

ET:

he has served in us govt during war time

DW:

interesting….

DW:

btw, is there anything more you want to add about Hyflux?

ET:

conclusion is “future is bright as people will need water forever, however, to expect the company to deliver as good investment is doubtful given the current valuation”

DW:

very good punch line!

ET:

remember, good company does not constitute as good investment if it’s bought @ a high price

DW:

thanks…what you write today is very valuable to me.

ET:

u should read another interesting book

ET:

four pillar of investing by william bernstein

DW:

cool cool….i will check it out at bookstore

AOTM Submission for May 2008 – Hyflux

For those who can’t wait, please click here for my report on Hyflux. Please do not forget to post or email your feedback, comments, critical arguments, constructive suggestions, etc…

In the meantime, I must make a few confessions:

1. This is the first time I really enjoy reading a company’s annual reports.

2. This is the first time I seriously work on an assignment since my O-levels. (I didn’t really put in a lot of effort in my University days either!)

3. This is the first time I really walk-the-talk by seriously applying what I have learnt in the past on analysing a company for investment purposes.

I remember the first time I came across the terms like “fundamental analysis”, “value investing”, “understanding financial statements”, etc. etc. was way back to year 2000, since then I had a great collection of classical books such as Benjamin Graham’s The Intelligent Investor and others on my bookshelves (you may refer to the book list tab for the complete list), which was put into ‘very good use’ that was no better than merely impress family visitors. I briefly read some of them, occassionally talked about them during coffee breaks only to impress fellow coffee-breakers on how widely read I was. I at best knew the theories well enough to talk intelligently with jargons but I had no practical experience on applying those theories into my real-life investment (although I did get lucky on some stocks I had bought). Of course, as I grew older and became more mature, I started to appreciate the theories, methodologies, mindsets of those great investors much much better; however, procrastination became my biggest road block. I knew the importance of applying what I have read and learnt on real-life cases through practice and trial-and-error and improve from there, I just simply didn’t really seriously take a first step into serious investment. Not until setting up this website early this month, which is 8 years later. (Warren Buffett would have killed me for losing the compounding opportunities of 8 great years without seriously investing!)

I remember my other good investment buddy, DmS, he once tested me with an IQ question: “Hey, in a dark night, you have a torch light and it can only reach 10 meters in front of you, what do you need to do if you want to see the road 20 meters in front of you?”. I proudly told him that the answer was simple, “Just walk forward 10 meters, so that your torch light can reach another 10 meters in front of you!”.

That was a wakening call.

No matter how smart, how widely-read you are, you need to take action and take small steps forward, in order to reach the goals you want to achieve.

I know my report on this little assignment is not flawless, but I am quite happy that I have moved forward with my little torch light and no matter how small the steps were, I know I am already closer to where I want to be.

I am happy because I have taken action. And I feel much cleverer after the assignment, and I hope I will become slightly richer soon.

Toyota: Gain or Loss?

Here are the headlines of 2 articles that I have read on the same day (9th May, 2008 ) from two different sources:

“Weak sales put brakes on Toyota’s profits” – source: TODAY paper, Singapore, dated 9th May, 2008.

“Asian stocks rise to highest since January; banks, Toyota gain” – source: The EDGE SINGAPORE, weekly edition for week starting 5th May, 2008.

Coincidentally, the primary source of these 2 articles is the same – Bloomberg. So, what is exactly going on with Toyota with these 2 obviously contradicting headlines? Here is the analysis.

First, to summarise the key points from TODAY:

1. 4th quarter profit dropped more than analysts estimated.

2. Forecast earnings will fall 27% due to sales slump in the US.

3. Net income fell 28% to 316.8 billion yen. Predicts annual net income to drop to 1.25 trillion yen in the year started April 1, from a record 1.72 trillion last year.

4. The stronger Japanese currency will probably trim 690 billion yen from operating profit – based on exchange rates of 100 yen to the dollar and 155 yen to the euro.

5. Nippon Steel Corp and JFE Holdings, Japan’s 2 biggest steel-makers, raised wholesale sheet steel prices 25 per cent last month to cover an unexpected tripling in annual coking coal prices. Hence, higher raw material costs.

Now, look at what THE EDGE covers:

1. Asian stocks rose…Toyota Motor Corp climbed after its US car sales increased for the first time in five months.

2. Toyota, the world’s No 2 automaker, advanced 2.8% to 5430 yen, its highest close since March 6.

3. The rest of the article covers that Asian stock prices in general rose.

Analysis

When reading contradicting news like these, first, we must compare an apple to an apple. The first article reported the performance of the company and the forecast earnings. It reported the fact that profit dropped and the forecast wll fall based on the sales slump in the US. Operating profit will suffer due to stronger yen and higher steel prices. The second article focused on the stock price of Toyota. A company’s fundamentals such as earnings might not directly reflect the stock price in the market as stock prices are very often affected by other factors than fundamentals, such as analysts’ expectation, market overall sentiment, existing trend and so on. Therefore, it is not correct to compare “earnings” with “stock price” in the very first place.

Secondly, the second article reported that “US car sales increased for the first time in five months”. There were no actual figures to support how significant was the increase and the increase in relative to the recent five months does not provide an insight on the company’s overall performance in terms of earnings. What the article meant to say is probably that the market felt more confident with Toyota after seeing an increase in five months, and therefore, the stock price rose and closed at a high since March 6.

Last but not least the important factor is: timing. THE EDGE is a weekly magazine and this particular article was originally published by Bloomberg on closing of 2nd May, 2008. How can we compare two different pieces of news which were reported 6 days’ apart? And more significantly, these 2 pieces of news were reported before and after corporate announcement. Market sentiments and stock prices swing drastically if what people believe and expect is not in sync with reality. I did a quick google and found out that the stock price indeed increased on 2nd May, however, on 8th May, Toyota reported profit loss and pessimistic forecast, despite the rally from 2nd to 7th May, the stock price fell from 104.76 to 100.21 in midday 8th May.

Lessons learnt: reading news and interpreting news are two different exercises. Reading without understanding the intent of the news may lead you to misinterpreting the underlying message. Overrelying on market prices without analysing the fundamentals will not give you correct insight on the true performance of a company. One last point, don’t act when you know there is an upcoming corporate announcement.

First take on P/E ratio

Last night, my wife asked me to check out a company called “Salesforce.com” which specializes in CRM applications. She thinks it is a good company because, apparently, it takes up a lot of market shares from CRM giant Siebel and product-wise, its flagship CRM application is supposed to be one of the best in the industry. A friend of hers who is working with “Salesforce.com” has the same opinion, opinions from ‘horse’s mouth’ should be quite credible.

Good products, good market shares, but is the stock good to buy too? I quickly checked it out at Google Finance: http://finance.google.com/finance?q=NYSE%3ACRM

 Salesforce@GoogleOn20080502

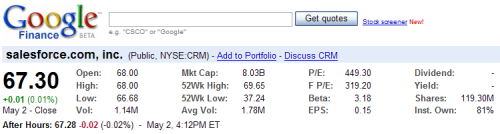
The number that first got my attention was the P/E ratio: 449.30.

In 1 sentence, it simply means that the market is willing to pay about 450 times for 1 dollar of earnings.

My impulsive reaction at that moment was as follows:

The Benjamin Graham in me immediately told me that ‘don’t bother to look into it, P/E ratio with anything >20 is considered high and hence overpriced. my strategy is always look at under-valued stocks and stocks with low P/E ratio.’

The William O’Neal in me said the opposite, ‘it is naive to base on P/E ratio alone to judge if it is overpriced! A lot of growth stocks in the past had large P/E ratios before they hit prices of more than 300% or even 3000% increase!’

Whatever conclusion, if any, came out of this impulsive reaction is definitely immature. So, let’s take a step back to understand the definition first and discuss further.

Definition

EPS = Earnings Per Share

Price to Earnings or P/E ratio = Market price/EPS

Earnings per share measures the returns to the common stockholders for every share invested. It is calculated by dividing bottom-line net income less any dividends paid to the preferred stockholders by the number of ordinary or common shares. Generally, when comparing two companies in the same industry and market, the one with higher EPS is more attractive as it is more profitable.

P/E ratio is basically the number of times the stocks of the company are selling in terms of the amount of earnings per share. Or from another angle, it is how many times the market is willing to pay for 1 dollar of earnings of the company.

Benjamin Graham’s value investing

I am not going to cover all aspects in value investing here, I just like to zoom into the P/E ratio’s aspect of it. In Graham’s “The Intelligent Investor” and Hagstrom’s “The Warren Buffet Way”, two Graham’s ‘basic’ approaches in common stock selection are mentioned, they, when applied, adhere to the ‘margin of safety’. The first approach is buying a company for less than two-thirds of its net asset value. The second approach is focusing on low P/E ratio stocks. Additionally the company must have some net asset value. In other words, the company must owe less than it is worth. Basically, we are looking into stocks selling at a discount to their intrinsic values and those companies which have below-average earnings now and therefore low P/E ratio – but will definitely have a positive and higher expected earnings in the future because of their overall good fundamentals.

William O’Neal’s focus on growth stocks

In O’Neal’s “How to make money in stocks”, his CanSlim methodology focuses on identifying ‘growth stocks’ which usually have high P/E ratios. Growth stocks would typically sell at high P/E ratios compared to the average stock, because of their expected higher earnings growth. Such companies had substantial growth in earnings in the past and because they have good fundamentals such as good products, the forecasted growth in earnings will correspondingly go up and so will the P/E ratio.

He criticises the common investors who blindly think stocks with high P/E ratios are overpriced. He quoted a few credible examples such as Xerox’s P/E ratio = 100 times in 1960 before it advanced 3300% in price; Syntex’s P/E ratio = 45 before price hike of 400% and so on to prove these people wrong.

My short and quick analysis

Compare across industry

What I wrote above on Graham’s and O’Neal’s school of thoughts are overly simplified. In their books, they cover a lot more on other aspects of company analysis which I will touch in my upcoming posts.

Back to the discussion of P/E ratio, there is no benchmark or standard for what P/E ratios should be. The P/E ratio should be compared with industry-wide and market-wide averages to judge whether it is too high or too low.

As such, I also did a quick Google on Oracle and SAP, their P/E ratios are: 22.11 and 20.93 respectively. Microsoft’s is 16.95 and IBM’s is 16.05. They all seem to have more ‘sensible’ P/E ratios as compared to Salesforce.com’s 450.

A hardcore O’Neal fan may still argue that we should look into it’s past earnings growth and do some time-trending analysis before we conclude if 450 is still high.

But this round, the Benjamin Graham in me won the battle, I would not bother to continue look into this company as it’s P/E ratio has already failed my first pass of stock selections. It’s way over-priced and the number 450 is way too ridiculous after comparing Salesforce.com with other software companies in the same industry and market. There is literally no ‘margin of safety’.

Sorry wifey, I give this stock a pass, even though it might be a potential growth stock, but I would rather spend my time analysing other more promising companies.

Understand under-valued stocks

One way to go deeper and understand why company with low P/E ratios are recommended as good buys is to first comprehend why the price of the shares has been under-valued by the market. In most cases, it is because the company has disappointing earnings recorded. As a result the average investor, who assumes that the poor performance of the company will continue, stays away from the stocks. But the truth is, such stocks are likely to have an above average growth in earnings in the future because of their good fundamentals. Consequently, as long as investors are misinformed about these stocks, the share prices wll remain to be undervalued. However, this state of ignorance will not last forever, very soon as more investors realise the good potential of the company, new demand for its shares is generated and investors wll chase the shares leading to a price rise. Well, on one hand, not all low P/E stocks are worthwhile investments, on the other hand, they are good buys if the performance of the company is expected to improve.

High P/E stocks go well in bull markets only?

To be fair to O’Neal, he is not really hard-core about sticking to high P/E ratios. His main point is that as quoted in his book: ‘P/E is an end effect, not a cause. Primary consideration should be given to whether the rate of change in earnings is substantially increasing or decreasing.’ But he maintains the stand that growth stocks usually have high P/E ratio and during his stock selection process, he watches out for stocks with high P/E ratio in bull market.

Another way O’Neal uses P/E ratios is to estimate the potential price objective for a growth stock over the next 6 to 18 months based on its estimated future earnings. He takes the earnings estimate for the next two years and multiply it by the stock’s P/E ratio at the initial chart base buy point multipled by 130%. However, he emphasised, again, this works only in bull market.

If you read his book carefully, he repeatedly reminded us to avoid high P/E bias during bull markets. While I cannot conclude that high P/E stocks go well only in bull markets, I am sure we definitely need to take market condition into consideration while picking high P/E stocks. That’s another reason why I would not take a second look at salesforce.com as it’s stock price has been trading ‘sideways’, not a clear-cut uptrend.

Common ground

While there are obvious differences between Graham’s and O’Neal schools of thoughts, one obvious thing O’Neal has in common with Graham is the importance of analysing the fundamentals of the company such as products, management, room to grow in terms of market share, etc. Would Graham blindly choose a company with low P/E ratio? Would Graham blindly select a second rate stock just because it was cheap? No, not without understanding the fundamentals and potential expected growth in the future and ensuring low P/E is not due to most ghastly earnings records.

Benjamin Graham actually did admit that focusing on low P/E and well below average price may ‘miss out company like Chrysler’ with high P/E ratio during bull run. So, in a way, he did acknowledge O’Neal’s approach but of course, he also subtly implied that his investment strategy could afford him to miss out potential opportunities in high P/E ratio stocks.

Wrap-up

There is no conclusion in this post. I would just like to use this post as a starting point to go deeper into the topic of fundamental analysis in the near future. P/E ratio was chosen as the ‘opening’ topic because this ratio is almost the most commonly mentioned number in any investment books, financial magazines and newspapers. Despite the fact that it’s the most ‘hyped’ ratio, not many people especially new investors know how to interpret it. Hope this little article help open up a bigger door to fundamental analysis.

References

1. The intelligent investors by Benjamin Graham

2. How to make money in stocks by WIlliam O’Neal

3. Handbook for stock investors by KC Goh

Postscript:

There seems to be a bug in Google site, if we divide market price by EPS, it should be 67.3/0.15=448.67, which is marginally smaller than what is published. We are not going to be nitpicky about this as this would not affect our discussion here.